If you’re a Python developer, we invite you to join us in making sofastats_lib the best Python statistics library it can be. Even if you don’t have any other contributions to make, we’d really welcome your GitHub stars to help promote the project. We’d also welcome help improving the developer experience. Any feedback on how we can do that would be welcome. Our attitude: if anything is confusing, that’s on us not you.
Repo url: https://github.com/sofastats/sofastats_lib.
Join the sofastats_lib community
February 28th, 2026Friendly Python Statistics Library Launched
January 25th, 2026Trusted statistical reporting is now available in the convenient form of a Python library. Welcome to SOFA Stats – No Sweat Stats!
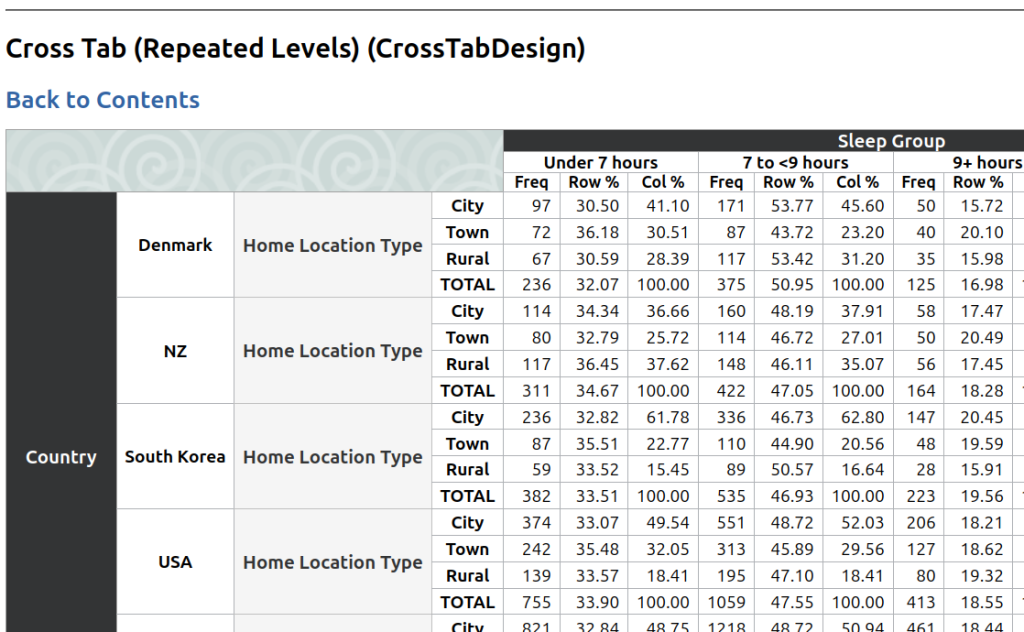
Perhaps you need to run an ANOVA, or a correlation analysis. Or you want to display your data as Box Plots, or nested Cross Tab tables.

sofastats_lib can help. Look at the Output Gallery to see what is available. Here is the output of a simple Cross Tab table (based on synthetic demonstration data):
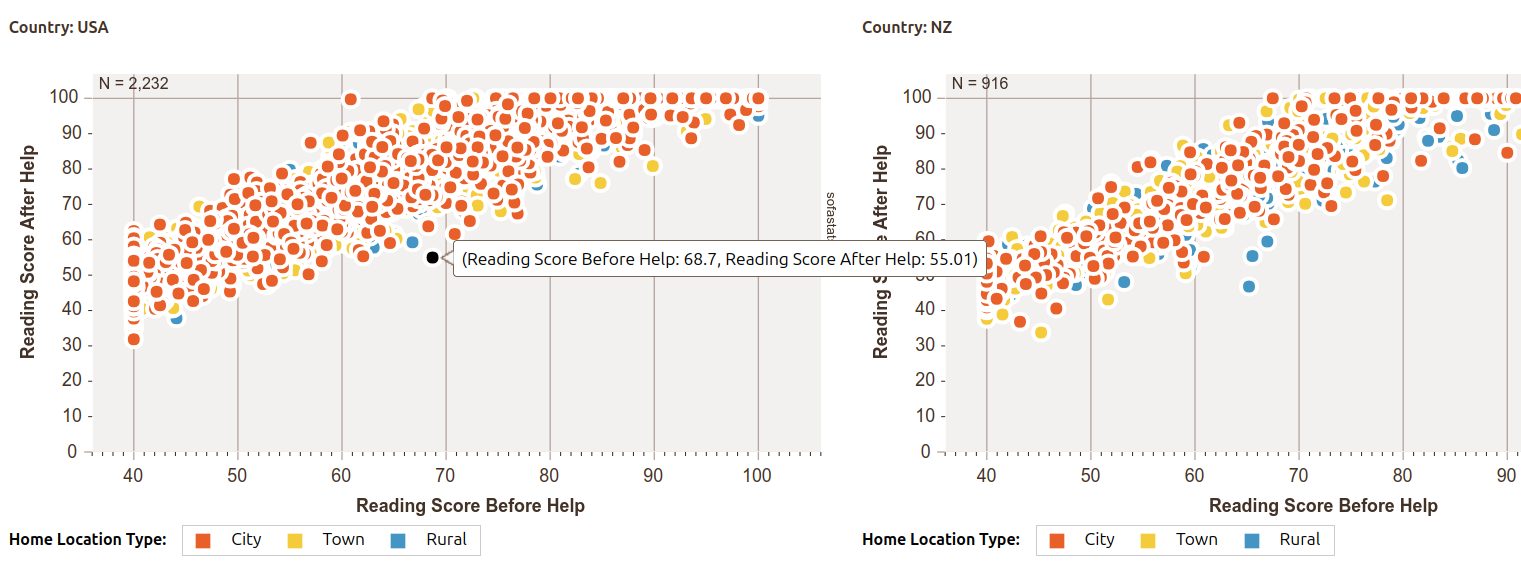
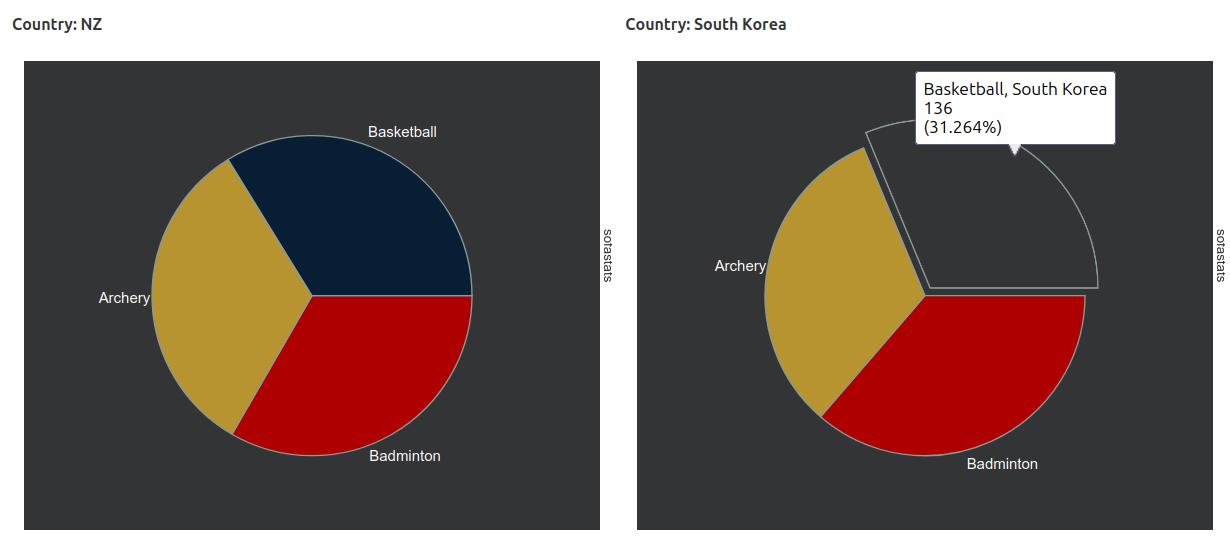
And here’s a preview of some of the charting options (also using synthetic data):

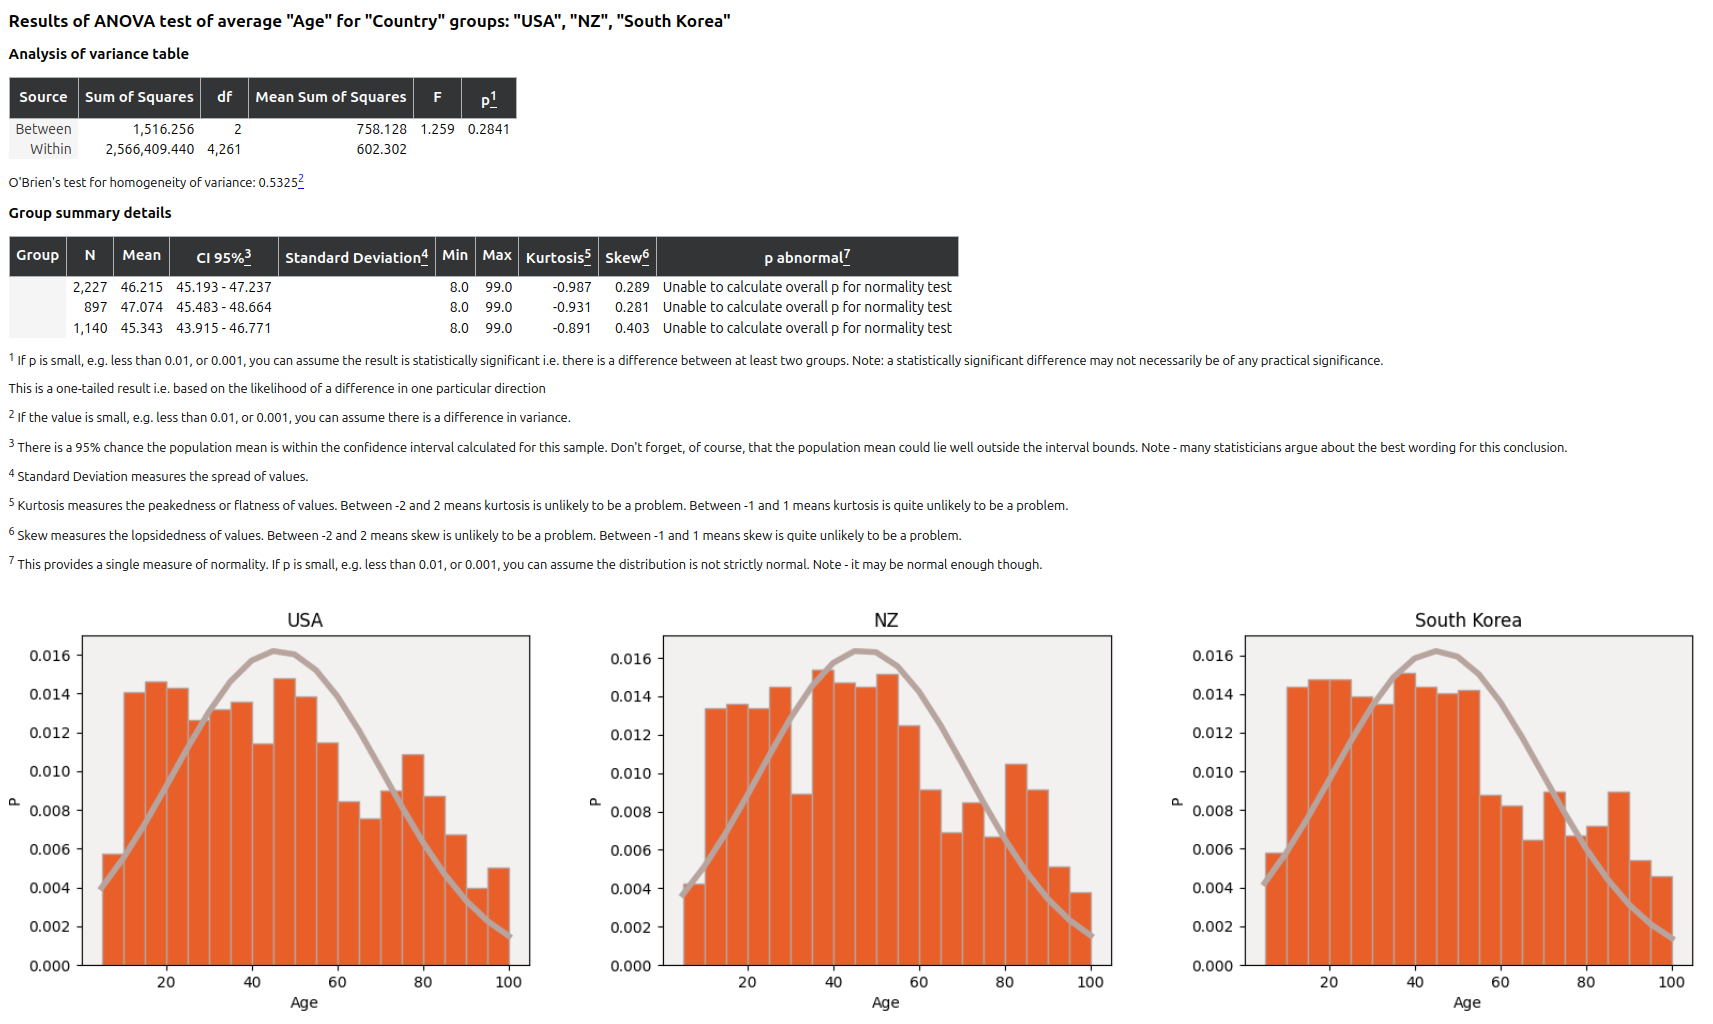
And the existing ANOVA documentation (once again, using synthetic data):
The full API is documented here: https://sofastats.github.io/sofastats_lib/API/ and there is a simple guide to making and reusing your own styles.
The easiest option is to start with a CSV. Just make sure it is long format not wide format (see Data Preparation).
sofastats_lib is based on the tried-and-true SOFA Statistics desktop application but can be used like any other Python library.
You can add it to your project in the usual way e.g. uv add sofastats_lib. Friendly installation and usage instructions are available at https://sofastats.github.io/sofastats_lib/
Let us know what you think of sofastats_lib. We can be contacted at grant@sofastatistics.com or you can add issues to the GitHub project. And please spread the word.
The When of Python
May 1st, 2023SOFA Statistics (and SOFA Lite) are both written in Python. SOFA Statistics was originally written in Python2 and ported into Python3. SOFA Lite is being written in Python 3.11 from the ground up and tries to use the best features that modern Python provides. Not all features added to Python recently are good features and sometimes it is hard to know which of multiple alternatives should be used – for example, should we use collections.namedtuple, typing.namedtuple, or dataclasses.dataclass? Which is where the When of Python project comes in – tag line:
Shrinking Python to fit our brains by providing guidance on when to use language features (and when not to)
Find out more at https://whenof.python.nz/blog and try out the demo app at https://whenof.python.nz. The project can also be followed at https://twitter.com/WhenOfPython

Maintenance Mode & SOFA Lite
January 7th, 2023SOFA Statistics is now in stable, maintenance mode. New releases are mainly for bug fixes.
If you have been having problems running SOFA on Ubuntu / Debian / Linux check out the new deb and archive downloads at https://www.sofastatistics.com/downloads.php
Alongside SOFA Statistics I have started SOFA Lite https://github.com/grantps/sofalite. This is an almost complete re-write using some of the latest Python 3 language features and a new code architecture. It is called SOFA Lite because I am stripping out some features that were painful to maintain but were of limited value to most users.
One design goal for SOFA Lite is to make it super-easy to run analyses from Python scripts rather than just via the GUI.
Another goal is to significantly reduce the complexity of packaging SOFA Lite for different operating systems. For example, 90% of the pain of packaging SOFA Statistics has related to its image processing libraries, none of which are really needed now that user-friendly screen-shot software is so widely available. I would love to be able to release a version of SOFA (Lite) that works on the latest versions of the Mac OS (alongside Windows and Linux) and this looks like a good way of making that possible.
So onwards and upwards again 🙂
Version 1.5.4 – Hopefully Boring ;-)
January 14th, 2021Version 1.5.4 of SOFA Statistics has been released. It supports a wider range of SQL Server versions and has numerous bug fixes. It:
- Supports more versions of MS SQL Server by switching to the pyodbc library (from a deprecated library)
- Standardises multiline checkboxes
- Copes with different versions of openpyxl without forcing Linux users to pin the version (which may not be in their distro)
- Fixes width of main form help text in Windows
- Fixes chart display bug in Windows by forcing IE11 emulation (vs IE7)
- Fixes spreadsheet export bug – use column letter rather than name
- Fixes bug when exporting CSV with label columns
- Fixes sorting in Data List reports
- Fixes bug where renaming a project left the original intact
- Fixes bug preventing decimal point settings being honoured in Summary report tables and Data List reports
In a sense, 1.5.4 is what I actually hoped 1.5.0 would be. It just took a while to identify and remove all the bugs in the 1.5 series resolved so far.
I am reasonably satisfied with the features available in SOFA so my main goals going forwards relate to stability as underlying technologies change below SOFA e.g. GUI platforms, operating systems etc. What I’d really like to do next is release a Mac version for the 1.5 series but that will require some help from the Mac developer community (see previous blog post).
Call for community help on packaging SOFA for Mac
May 25th, 2019SOFA 1.5.1 has just been released but unfortunately only for Windows, Ubuntu, and other Linux distros. Mac users cannot install the latest version of SOFA and I suspect the package for SOFA 1.4.6 doesn’t work on modern Mac systems. So it is probably time to package SOFA 1.5.1 for contemporary Mac systems. Hence the call for community help.
I have managed to make a Windows package using pyinstaller and hopefully it will be relatively easy for a Mac developer with packaging skills (and already-installed software dependencies) to pick up the spec file and create a functional package for other Mac users. Obviously I would be willing to assist but without community help there won’t be a version of SOFA available for Mac.
Is this something you could help with – possibly in conjunction with a few other volunteers? I would be happy to add credits to the downloads page so people could recognise your input in making SOFA available on Mac. If interested contact me via https://www.sofastatistics.com/contact.php.

Version 1.5.1 mops up variety of bugs
May 19th, 2019SOFA Statistics 1.5.0 was a big change from previous versions in terms of its underlying technologies. Unfortunately that meant a number of bugs made it past release testing. Every bug identified so far has been fixed in 1.5.1 so now is a good time to upgrade.

SOFA turns 10!
May 15th, 2019SOFA Statistics was first released in May 2009. Since that time SOFA has been downloaded nearly 300,000 times – which is about 10,000 times more than I ever expected :-). Since that time many statistics packages have faded away and others have risen. Hopefully, SOFA Statistics has been a good option for many people and the recent replatforming onto Python 3 and wxPython 4 will enable SOFA to continue for many years to come.
Worked examples in 1.5.0
May 15th, 2019Statistics can be mind bending and complex. It can make your brain hurt and your heart despair. But sometimes it is very simple and easy to follow. Four of the statistical tests provided by SOFA Statistics – namely
- Mann-Whitney U
- Wilcoxon’s Signed Ranks
- Spearman’s Rho
- Pearson’s Chi Square
– are reasonably easy to understand with worked examples. You could even say they are elegant in their simplicity. Check out the new worked examples feature of SOFA Statistics version 1.5.0.
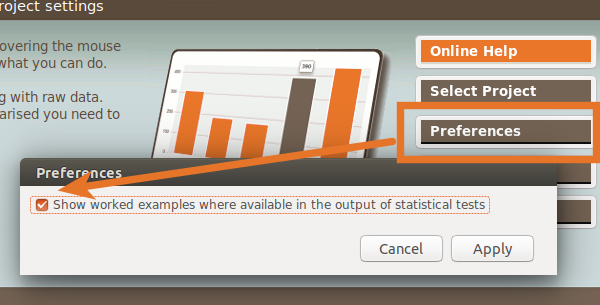

The worked examples use your actual data so you should be able to follow the logic of the test step-by-step if you are interested in learning how it works. The goal is to demystify the tests and appreciate them better.
Other changes in version 1.5.0 include the following:
- You can now choose the number of decimal places to show in report tables and charts.
- Can display counts or percentage separately on pie charts.
- Better smoothed line displayed for line charts.
- Easier to run generated scripts for testing (only need to set use_locally boolean).
- Better visual separation of subtables.
- Charts can show N.
- Improvements to darker themes.
- Add ability to define table to automatically open on startup (using open_on_start setting in projs/default.proj).
- Ask users if they want to override existing project if adding new project with an already-used name.
- Upgraded to newer GUI library (wxPython 4.0).
- Added new safeguards and user feedback when problems converting output to images.
- Dropped support for xls (xlsx is supported alongside tsv, csv, ods etc)
- Dropped support for CUBRID (largely because drivers for newer versions of Python are not available)
There are also numerous important bug fixes:
- Important bug fix for filters with OR conditionals.
- No longer fails to copy to clipboard when chart names include slashes.
- Scatterplots now cope with variable names including percentage symbols.
- Fixed bug displayed empty values in Display Data report tables.
- Fixed bug with Select All/Deselect All button not working correctly in all cases.
- Fixed bug when repairing duplicate names in import.
- Only give project override warning when a new file
- Add sky.css to styles deployed
SOFA Statistics has received a major overhaul under the hood for version 1.5.0 (for example, the shift to Python 3.6/7 from 2.7). Inevitably there will be some issues but the intention will be to resolve those as quickly as possible. Enjoy!
Nearly ready to release 1.5.0
April 29th, 2019Version 1.5.0 is nearly ready to release and not before time ;-). The last release was 1.4.6 in January 2016 but the time since then has not been wasted. Here are some of the changes ready to go:
- SOFA will be able to display worked examples for the following statistical tests:
- Mann-Whitney U
- Wilcoxon’s Signed Ranks
- Spearman’s Rho
- Pearson’s Chi Square
- It will be possible to choose the number of decimal places to show in report tables and charts
- SOFA will be able to display counts or percentage separately on pie charts
- There will be better smoothed line will be displayed for line charts
- Better visual separation of subtables
- Charts will be able to show N
- Improvements to darker themes
- Numerous bug fixes
Under the hood, SOFA has had some major changes:
- Python 3.6+ (Linux) / 3.7 (Windows)
- wxPython GUI toolkit is 4.0 (up from 2.8)
Sadly, the 1.5.0 release will not include a Mac package but later versions might do depending on practical considerations and offers of packaging help from Mac users. A deb package is already generated for Ubuntu / Debian. A Windows package is nearly ready – SOFA works on Windows 10 and all the dependencies have been baked into an executable ready for the final stages of packaging.
It is expected there will be a few minor bugs slipping through given the scale of the changes underneath but the plan is to quickly release 1.5.1 with these mopped up.