More steady improvements to SOFA:
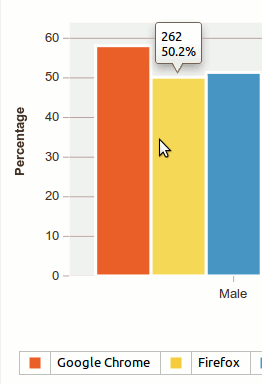
- Added ability to chart percentages as well as frequencies.

- Chart series now all have consistent y-axes (trellis style).

And there have been some bug fixes:
- Fixed ODS import bugs when encountering fields formatted as fractions, boolean, percentage etc.
- Fixed bug stopping linked images external to the html e.g. generated by matplotlib, from displaying in the internal GUI if the report path was different from the default report path.
- Fixed bug when running scatterplots and histograms with chart by (because of use of dd object which cannot be used headless).
- Fixed bug in charts dialog where second variable drop down would sometimes be overly restrictive when doing a chart of average values.
- Fixed bug where old pycs can interfere with Windows upgrades.
Enjoy!
[…] Veja outras novidades aqui […]
[…] Pueden ver una lista detallada de los cambios en este enlace. […]