If you’re a Python developer, we invite you to join us in making sofastats_lib the best Python statistics library it can be. Even if you don’t have any other contributions to make, we’d really welcome your GitHub stars to help promote the project. We’d also welcome help improving the developer experience. Any feedback on how we can do that would be welcome. Our attitude: if anything is confusing, that’s on us not you.
Repo url: https://github.com/sofastats/sofastats_lib.
Archive for the ‘python’ Category
Join the sofastats_lib community
Saturday, February 28th, 2026Friendly Python Statistics Library Launched
Sunday, January 25th, 2026Trusted statistical reporting is now available in the convenient form of a Python library. Welcome to SOFA Stats – No Sweat Stats!
Perhaps you need to run an ANOVA, or a correlation analysis. Or you want to display your data as Box Plots, or nested Cross Tab tables.

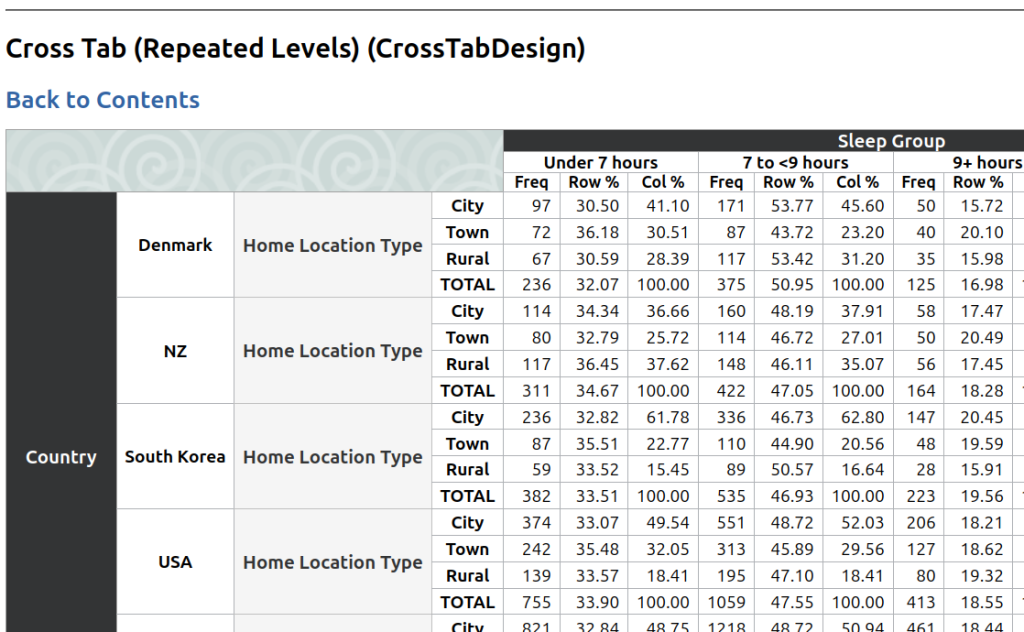
sofastats_lib can help. Look at the Output Gallery to see what is available. Here is the output of a simple Cross Tab table (based on synthetic demonstration data):
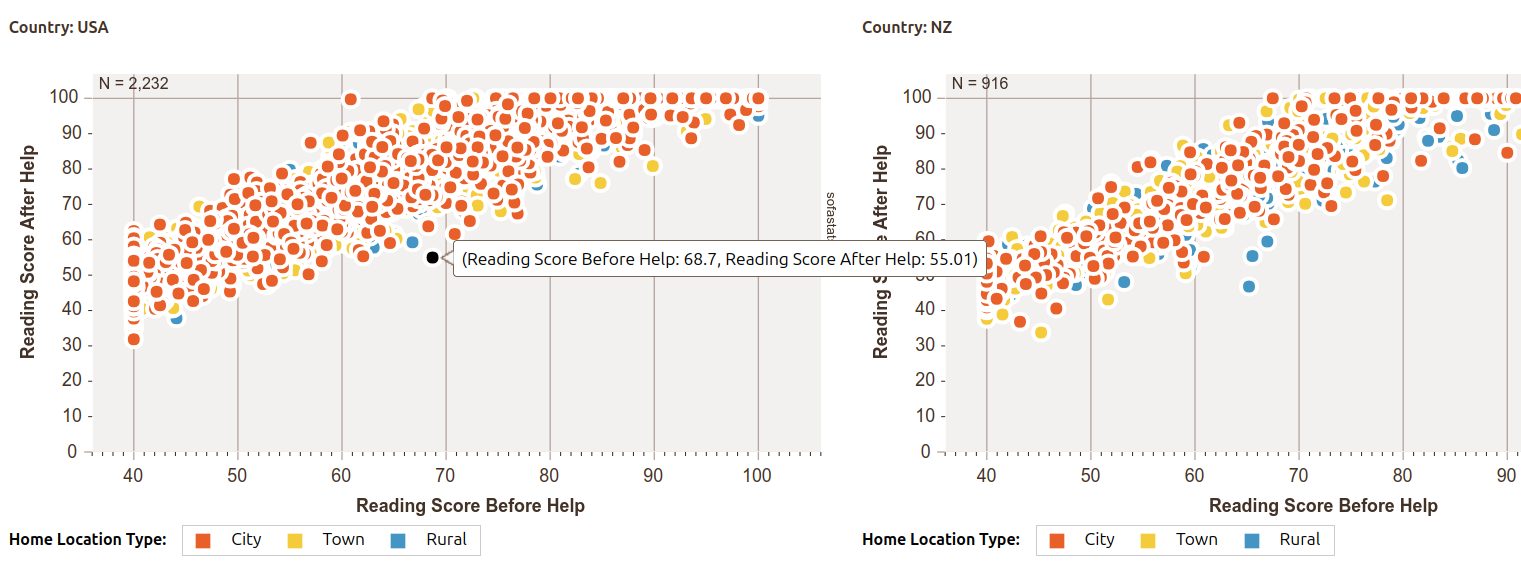
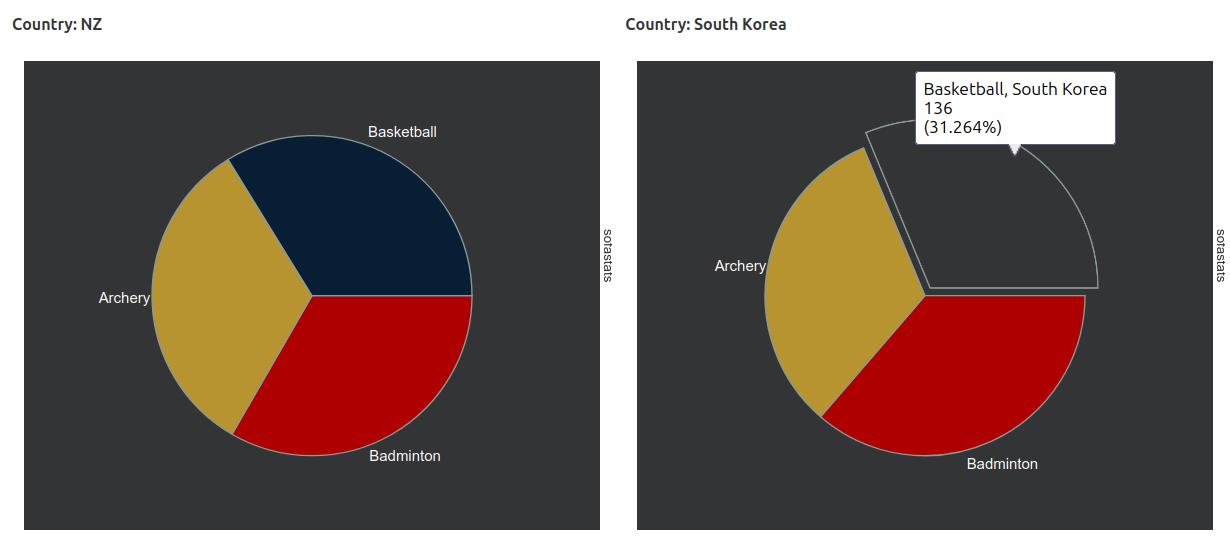
And here’s a preview of some of the charting options (also using synthetic data):

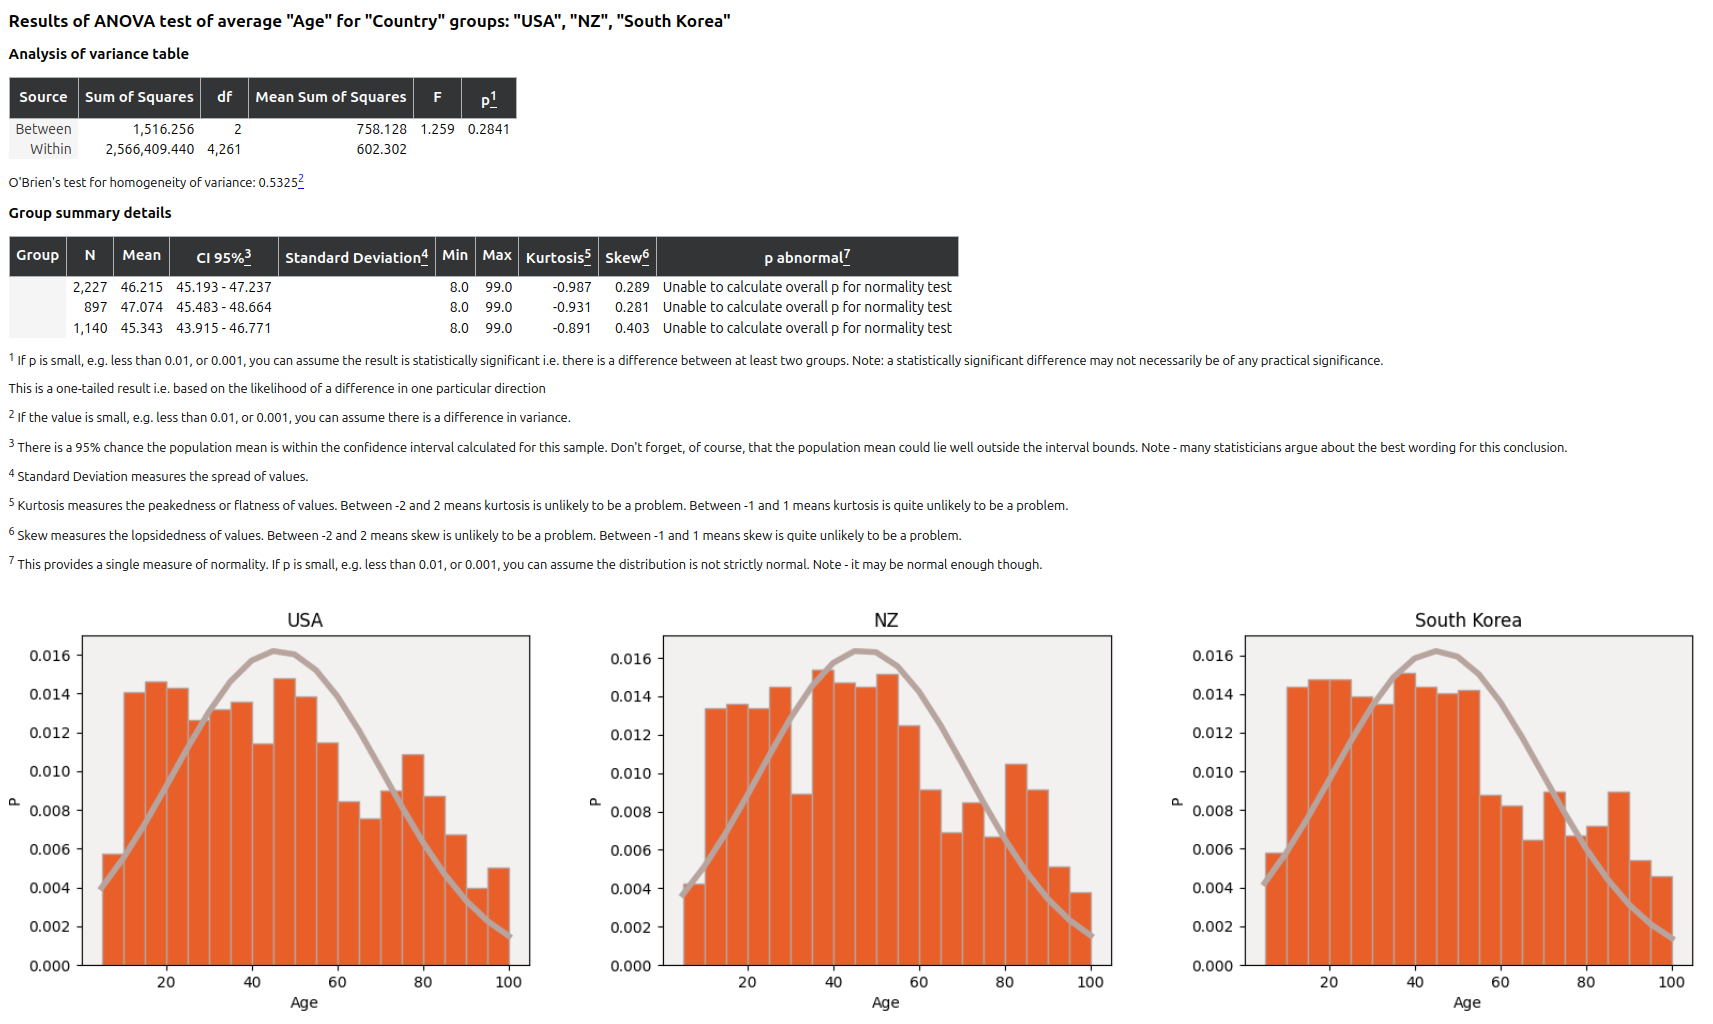
And the existing ANOVA documentation (once again, using synthetic data):
The full API is documented here: https://sofastats.github.io/sofastats_lib/API/ and there is a simple guide to making and reusing your own styles.
The easiest option is to start with a CSV. Just make sure it is long format not wide format (see Data Preparation).
sofastats_lib is based on the tried-and-true SOFA Statistics desktop application but can be used like any other Python library.
You can add it to your project in the usual way e.g. uv add sofastats_lib. Friendly installation and usage instructions are available at https://sofastats.github.io/sofastats_lib/
Let us know what you think of sofastats_lib. We can be contacted at grant@sofastatistics.com or you can add issues to the GitHub project. And please spread the word.
The When of Python
Monday, May 1st, 2023SOFA Statistics (and SOFA Lite) are both written in Python. SOFA Statistics was originally written in Python2 and ported into Python3. SOFA Lite is being written in Python 3.11 from the ground up and tries to use the best features that modern Python provides. Not all features added to Python recently are good features and sometimes it is hard to know which of multiple alternatives should be used – for example, should we use collections.namedtuple, typing.namedtuple, or dataclasses.dataclass? Which is where the When of Python project comes in – tag line:
Shrinking Python to fit our brains by providing guidance on when to use language features (and when not to)
Find out more at https://whenof.python.nz/blog and try out the demo app at https://whenof.python.nz. The project can also be followed at https://twitter.com/WhenOfPython

Maintenance Mode & SOFA Lite
Saturday, January 7th, 2023SOFA Statistics is now in stable, maintenance mode. New releases are mainly for bug fixes.
If you have been having problems running SOFA on Ubuntu / Debian / Linux check out the new deb and archive downloads at https://www.sofastatistics.com/downloads.php
Alongside SOFA Statistics I have started SOFA Lite https://github.com/grantps/sofalite. This is an almost complete re-write using some of the latest Python 3 language features and a new code architecture. It is called SOFA Lite because I am stripping out some features that were painful to maintain but were of limited value to most users.
One design goal for SOFA Lite is to make it super-easy to run analyses from Python scripts rather than just via the GUI.
Another goal is to significantly reduce the complexity of packaging SOFA Lite for different operating systems. For example, 90% of the pain of packaging SOFA Statistics has related to its image processing libraries, none of which are really needed now that user-friendly screen-shot software is so widely available. I would love to be able to release a version of SOFA (Lite) that works on the latest versions of the Mac OS (alongside Windows and Linux) and this looks like a good way of making that possible.
So onwards and upwards again 🙂
Nearly ready to release 1.5.0
Monday, April 29th, 2019Version 1.5.0 is nearly ready to release and not before time ;-). The last release was 1.4.6 in January 2016 but the time since then has not been wasted. Here are some of the changes ready to go:
- SOFA will be able to display worked examples for the following statistical tests:
- Mann-Whitney U
- Wilcoxon’s Signed Ranks
- Spearman’s Rho
- Pearson’s Chi Square
- It will be possible to choose the number of decimal places to show in report tables and charts
- SOFA will be able to display counts or percentage separately on pie charts
- There will be better smoothed line will be displayed for line charts
- Better visual separation of subtables
- Charts will be able to show N
- Improvements to darker themes
- Numerous bug fixes
Under the hood, SOFA has had some major changes:
- Python 3.6+ (Linux) / 3.7 (Windows)
- wxPython GUI toolkit is 4.0 (up from 2.8)
Sadly, the 1.5.0 release will not include a Mac package but later versions might do depending on practical considerations and offers of packaging help from Mac users. A deb package is already generated for Ubuntu / Debian. A Windows package is nearly ready – SOFA works on Windows 10 and all the dependencies have been baked into an executable ready for the final stages of packaging.
It is expected there will be a few minor bugs slipping through given the scale of the changes underneath but the plan is to quickly release 1.5.1 with these mopped up.
What might be coming next
Wednesday, April 20th, 2016Python 2 is reaching its End Of Life (EOL) in 2020 so sometime before then I will want to shift SOFA to Python 3. I much prefer Python 3 but the main thing will be the libraries SOFA relies on to operate – especially on Windows and Mac.
Speaking of Mac, I am finding it very time-consuming supporting the platform. Not to enable SOFA’s core functionality to work but for the image processing libraries (esp convert and gs). Along the way I have spent countless weekends compiling using homebrew etc. Slow, tricky, and often fruitless. And it is difficult to test. I only have access to a Snow Leopard machine (virtualised to allow revert to snapshot) and that is no longer very relevant to what people need for newer versions of OS X. Some very kind people have offered to help with testing (thanks!) but the problem seems to be the packaging steps. Maybe what I need to do is ask the people who volunteered if any of them are able to compile convert and gs for me on their machines. I can then just include those versions in my packages and hopefully everything works.
A final work item is to add a Fisher’s LSD test. A friend is helping with this.
GUI performance nightmare if shrinking font of drop-down lists
Wednesday, July 18th, 2012I was wanting to shrink the font of elements of the SOFA GUI dialogs so I could squeeze more in or relocate items to more logical positions. Can’t be that hard, surely? I have since discovered that if a drop-down list (wxPython wx.Choice widget) has lots of items e.g. 30+ it takes seconds for fresh items to be added the the widget if you are trying to use your own font selection (using setFont()) on Linux. SetItems() takes a long time as, presumably, it sets the font for each individual item. And given I can’t control how many items will appear in drop-down lists or avoid having to repopulate lists (e.g. new data table selected so variable lists have to be updated) the option of shrinking fonts is not viable. Back to the drawing board.
[UPDATE] I came up with a workaround. Because there is no performance problem when items are included with the initial instantiation of dropdown widgets, all dropdowns are rebuilt each time they are changed. This means they have to be destroyed before being replaced, and the panel they are on must be hidden temporarily to avoid flicker on Windows, but it works. The fact that I was able to clean up some code in the process almost compensates for the considerable extra work 🙂
Honey I Shrunk the Installers
Monday, December 19th, 2011The SOFA installers for Windows and Mac have shrunk substantially – from 43MB to 25MB for Windows and from a rather hefty 85MB to 36MB for Mac. They’ll be quicker to download, and the new installers also avoid possible conflicts with other Python packages on a system. It’s all self-contained. A final benefit is that the installation process itself has become much simpler, with much fewer steps. For those who are technically minded, it is thanks to pyinstaller and py2app (with some initial help from Gui2exe).
Making better installer for SOFA using Pyinstaller
Friday, December 9th, 2011As SOFA Statistics has gained more functionality it has grown in complexity – there are modules for reading Excel spreadsheets, connecting to Google Docs spreadsheets, displaying charts, displaying GUI widgets etc. Trying to make a single executable for Windows users was always going to be a challenge and would probably involve a lot of trial and error. So it proved.
But there was one technique I used to make the seemingly impossible task manageable. I made a single python script I called launch.py which was responsible for importing all the main modules the executable would need to handle (e.g. matplotlib, MySQLdb etc). I identified the imports I would need by looking at each and every main module in SOFA and adding any external library module imports not already included.
The process of making an executable failed initially, so by variously commenting and uncommenting parts of the launch script I was able to isolate problem modules and fix them. To get PostgreSQL working, for example, I needed to add the following fix:
try:
    # I needed to add the Postgres library directory to the PATH
    # variable in Windows. Apparently when Postgres is installed under Windows as a
    # service, this isn't done automatically (no need to) so that library isn't
    # available. [http://osdir.com/ml/python.db.pygresql/2008-03/msg00021.html]
    # OK to hardwire to version available to my installer dev environment. The user experience
    # will depend on whether they have set the PATH properly.
    os.environ['PATH'] += ";C:\\Program Files\\PostgreSQL\\9.1\\bin"
    import pgdb
except ImportError, e:
    pass
Here is the full text of launch.py:
#! /usr/bin/env python
# -*- coding: utf-8 -*-

from __future__ import absolute_import
from __future__ import division # so 5/2 = 2.5 not 2 !
from __future__ import print_function

# remove import __future__ from dbe_sqlite
import cgi
import codecs
from collections import defaultdict
from collections import namedtuple
import copy
import csv
import datetime
import decimal
import gettext
import glob
import locale
import math
from operator import itemgetter
import os
import platform
import pprint
import random
import re
import shutil
import socket
import subprocess
import sys
import time
import traceback
from types import IntType, FloatType, ListType, TupleType, StringType
import warnings
import weakref
import webbrowser
import xml.etree.ElementTree as etree
import zipfile

# Even though not used here pyinstaller won't know about it otherwise
# and will not have it when encountered in import2run.py/start.py etc

import MySQLdb as mysql
try:
    # I needed to add the Postgres library directory to the PATH
    # variable in Windows. Apparently when Postgres is installed under Windows as a
    # service, this isn't done automatically (no need to) so that library isn't
    # available. [http://osdir.com/ml/python.db.pygresql/2008-03/msg00021.html]
    # OK to hardwire to version available to my installer dev environment. The user experience
    # will depend on whether they have set the PATH properly.
    os.environ['PATH'] += ";C:\\Program Files\\PostgreSQL\\9.1\\bin"
    import pgdb
except ImportError, e:
    pass
import sqlite3 as sqlite # using sqlite3.dll from Python 2.7 so includes foreign key support

#import wxversion
#wxversion.select("2.8") # Not needed when using executable.

# http://groups.google.com/group/pyinstaller/browse_thread/thread/1b57e64ddc35e772
if not hasattr(sys, 'frozen'):
    import wxversion
    wxversion.select('2.8')
import wx
import wx.lib.iewin as ie
import wx.gizmos
import wx.grid
import wx.html
try:
    from agw import hyperlink as hl
except ImportError: # if it's not there locally, try the wxPython lib.
    import wx.lib.agw.hyperlink as hl

# problem locating eggs folder - solution in http://www.pyinstaller.org/ticket/185
# change pyinstaller-1.5\support\_pyi_egg_install.py
#if os.path.isdir(d):
#    for fn in os.listdir(d):
#        sys.path.append(os.path.join(d, fn))


import numpy as np
#if hasattr(sys, 'frozen') and sys.frozen:
#    import numpy.core.ma
#    sys.modules['numpy.ma'] = sys.modules['numpy.core.ma']

# if include matplotlib before sys.path, matplotlib.collections shadows collections and won't find namedtuple

# Currently problem with Path in environment MATPLOTLIBDATA not a directory
# Must put mpl-data folder in same folder as the executable is finally run from

import matplotlib
#import matplotlib.numerix as Numerix
#from matplotlib.axes import _process_plot_var_args
#from matplotlib.backend_bases import FigureCanvasBase
#from matplotlib.backends.backend_agg import FigureCanvasAgg, RendererAgg
#from matplotlib.backends.backend_wxagg import FigureCanvasWxAgg
#from matplotlib.figure import Figure
#from matplotlib.font_manager import FontProperties
#from matplotlib.projections.polar import PolarAxes
#from matplotlib.transforms import Bbox

# connected to matplotlib
# don't exclude Tkinter, Tkconstants
import wxmpl
import pylab # must import after wxmpl so matplotlib.use() is always first
# don't import boomslang - trouble with import pylab in many cases, even import math.
# works fine if matplotlib baked into exe
#import boomslang

# no need to bake googleapi in as nothing installed as such. Just ensure not using stale pycs from Ubuntu system.
#import googleapi
# problem with import os etc if using below
#import googleapi.gdata.spreadsheet.service as gdata_spreadsheet_service
#import googleapi.gdata.spreadsheet as gdata_spreadsheet
#import googleapi.gdata.docs.service as gdata_docs_service
#import googleapi.gdata.service as gdata_service

# no need to bake xlrd in as nothing installed as such. Just ensure not using stale pycs from Ubuntu system.
#import xlrd

import adodbapi
import pywintypes
import win32api
import win32con
import win32com
import win32com.client

import dao36_from_genpy # go to makepy/genpy and look in py files till found - taken and rename and relocate so can directly call

import import2run
The code for SOFA is cross-platform and I start the Windows packaging process by copying everything across from Ubuntu. It is important in such a case to wipe all pyc files so that platform-specific ones are created for Windows and included in the executable creation process.
The final import statement is for import2run.py. This means that the executable doesn’t hardwire anything beyond the imports. As it happens I started by having import2run contain just the following line:
raw_input("Success!!")
Later, once all the basic imports were working, I changed it to:
import start
to actually load SOFA. NB the executable created using the technique described here doesn’t replace all the SOFA modules with a single executable – its purpose is to replace Python and all the extra libraries such as matplotlib. So the exe is expected to live in the main SOFA program folder (usually in C:\Program Files\sofastats) alongside the usual modules such as core_stats.py. If a user actually had Python 2.6 and all the libraries installed they could either use the exe or run start.py directly themselves. It would have the same effect.
Getting matplotlib to work took a while and involved many false leads. In the end the solution was to copy the entire mpl-data folder (from somewhere like C:\Python26\Lib\site-packages\matplotlib) into the same folder as the sofastats.exe was going to end up.
Some final things I learned about Pyinstaller. –onedir is the default and adds the coll = COLLECT(…) part of the spec file. If making manual changes remember that if you want the onedir approach, don’t include a.binaries in the EXE(…) part and exclude_binaries should be True. If, like myself you want a single executable file, don’t bother with coll = COLLECT(…), include a.binaries, and set exclude_binaries to False. And while testing set debug=True and Console=True so you can see what is going wrong as you refine your spec file, launch.py script etc.
Although GUI2EXE is a wonderful program some aspects may not be compatible with Pyinstaller 1.5.1 so I now build my spec file using makespec.py with the –onefile argument. It works in its basic vanilla form for SOFA using launch.py. You can export the spec file GUI2EXE makes and see the differences.
Here is the final spec file I used:
# -*- mode: python -*-
# used MAKESPEC 1.5.1 with --onefile option
# NB must include mpl-data folder under main sofastats level (i.e. sibling of dbe_plugins etc) for matplotlib to work
# manually set level=9 in PYZ params (inspired by how GUI2EXE did it)
# manually replaced name=os.path.join('dist', 'launch.exe'), with name='C:\\sofastats_build_exe\\sofa.main\\sofastats.exe',
# manually set debug=True, upx=False in EXE params
# manually set exclude_binaries=False in EXE params

a = Analysis([os.path.join(HOMEPATH,'support\\_mountzlib.py'), os.path.join(HOMEPATH,'support\\useUnicode.py'), 'C:\\sofastats_build_exe\\sofa.main\\launch.py'],
             pathex=['C:\\Python26\\pyinstaller-1.5.1'])
pyz = PYZ(a.pure, level=9)
exe = EXE( pyz,
          a.scripts,
          a.binaries,
          a.zipfiles,
          a.datas,
          exclude_binaries=False,
          name='C:\\sofastats_build_exe\\sofa.main\\sofastats.exe',
          debug=True,
          strip=False,
          upx=False,
          console=True )
Before going live switch debug and console to False.
This post is largely specific to SOFA Statistics but hopefully it includes some tips which might save others a lot of fruitless struggle. If you have trouble, I found the pyinstaller mailing list people helpful.
SOFA Statistics and the “R is an Epic Fail” blog
Monday, April 26th, 2010R is an open source programming language and software environment for statistics. And it is not just any old programming language – it is the dominant system for open source statistics. So was it fair to call R an “epic fail” as Dr. AnnMaria De Mars did in her notorious blog post The Next Big Thing?
Clearly R has been a massive success and it has a vibrant and lively community, many of whom were galvanised into making a response by the Epic Fail blog (see An article attacking R gets responses from the R blogosphere – some reflections on the phenomenon and R and the Next Big Thing as an example). So on what terms could it be considered a failure? For De Mars, successful software will be usable by the vast majority of people – not just programmers and others comfortable with command line interfaces.
… if you even LOOK at R code – bug-free or not, compilable or not – it should be evident that this is not how the average person uses a computer. If we are talking about something that is going to be used by a large number of people, R is not it (Comment by De Mars on her own blog post – The Next Big Thing).
… If your target market is “People who own cars that drive from point A to point B” that is much BIGGER than “people who work on engines”. If you are looking for a job making things or selling things or providing services, the former is more likely to pay off for you than the latter.
Telling people that if they can’t appreciate an internal combustion engine they are too stupid to own a car probably won’t help, either.” (The Next Big Thing).
And in these terms, De Mars has a point. For many users, R needs a GUI. I like this quote tweeted by ravkalia (a big fan of R BTW): “Overheard at a computing meeting: ‘R is not a programming language, it’s a statistics package with the GUI missing.'” Of course there are various projects to provide a GUI interface for R but it can be argued there are limits to how far that can go given the inherent flexibility of R as an environment. Yihui Xie recently commented – “I prefer the command-line due to its flexibility. GUI cannot hold infinite components (buttons, drop-lists, check-boxes, …), whereas there are almost infinite possibilities in commands.” (r-is-an-epic-fail).
On her other points regarding R and data visualisation, and analysis of enormous quantities of unstructured data, De Mars is on shakier ground, but the observations about the mainstream preference for looking and clicking are valid.
So how does this relate to SOFA Statistics? SOFA stands for Statistics Open For All, which gives a strong hint as to where SOFA is aiming in terms of user interfaces and target audience. In practice this means:
- A simple GUI. In practice, this means trying hard to leave the right things out rather than adding in every possible option. Sometimes less is more. Think about your TV remotes.

Interface chaos
Some commentators have implied that a GUI is not important because the sorts of people who do statistics will also be comfortable with basic programming. But this is not always true. And lots more people, by several orders of magnitude, need to run basic statistical analyses than just specialist statisticians. Karen Grace-Martin put it especially well in her response to the Epic Fail post:
“I primarily help researchers, mainly in biology and social science, apply statistics to their research. They are not doing “business analytics,” do not have enormous databases, and really have no need to program anything beyond what SAS or SPSS syntax does. They are not programmers or statisticians, and they don’t have backgrounds in programming or math.
I believe they are the kinds of users of statistics that you are referring to and I agree with you wholeheartedly that they are probably the majority of statistics users and they have no need for a programming language. They don’t want to nor need to program new statistical procedures.
There are clearly people who do, but I agree they’re not the majority. At least not in the fields I work.” (The Next Big Thing).
Even full-time specialist statisticians may find it easier to use a simple GUI for basic data exploration e.g. generating simple frequency tables and cross tabs. It has been suggested that people should expect to use more than one package (SPSS, SAS, R, Stata, JMP? Choosing a Statistical Software Package or Two) SOFA Statistics may be a useful complement to R for many users.
And ease of use should not be premised on the assumption that people will be heavy users of the package – or of statistics in general, for that matter. The program needs to make it easy to become productive in a hurry.
- High priority on aesthetics. Output needs to look attractive; beautiful if possible.

Lucid spirals demo
Even the program itself needs to look good:

Form for selecting appropriate statistical test
- One True Way of Doing Things. It is not enough that there is a way of doing something – it can’t be buried somewhere obscure, and it has to clearly stand out as being correct and current (unlike some community technical advice).
* In the Zen of Python (type import this into your Python interpreter) there is this gem: “There should be one– and preferably only one –obvious way to do it.”
- Helping the user when errors occur. Ideally, there would never be any errors but given there are it is important to make them as useful as possible. This is an ongoing project in SOFA Statistics which is being given a high priority. Error messages are an important part of the interface and one of the most important to get right. The better the error messages, the less support people need and the happier they are (under the circumstances). Jon Peck commented on an unhelpful error message he receives from R:
Here is an error message that I get a lot from a popular R package.
‘Error in optim(0, f, control = control, hessian = TRUE, method = “BFGS”) :
non-finite finite-difference value [1]’
I know what that means. Would an analyst?
(Jon Peck – in response to The Next Big Thing) - Not relying on users to stitch together everything they need. Ordinary users benefit if their application bundles together related output. This is a balancing act and one which we want to get right for the target user group for SOFA Statistics. The following quote captures the tradeoffs well:
But one thing is clear to me: R aims at people who know what they are doing. Absolutely. You can see this with standard output in R which is very minimalistic. You must ASK R what you want from it. SAS and SPSS put everything out. And therefore you need to know how to program in R to use it, really. But if you do, you feel bound and limited with SAS or SPSS. (comment by mocianmomo in response to SAS v. R: Ease of learning).
- SOFA Statistics uses Python for Scripting. Python is a language consciously designed to be easy to learn. Many statisticians find it a pleasure to work with Python but the same is not always true of the syntax of many statistics packages, especially those with lots of historical cruft.


Example SOFA script in Python