Trusted statistical reporting is now available in the convenient form of a Python library. Welcome to SOFA Stats – No Sweat Stats!
Perhaps you need to run an ANOVA, or a correlation analysis. Or you want to display your data as Box Plots, or nested Cross Tab tables.

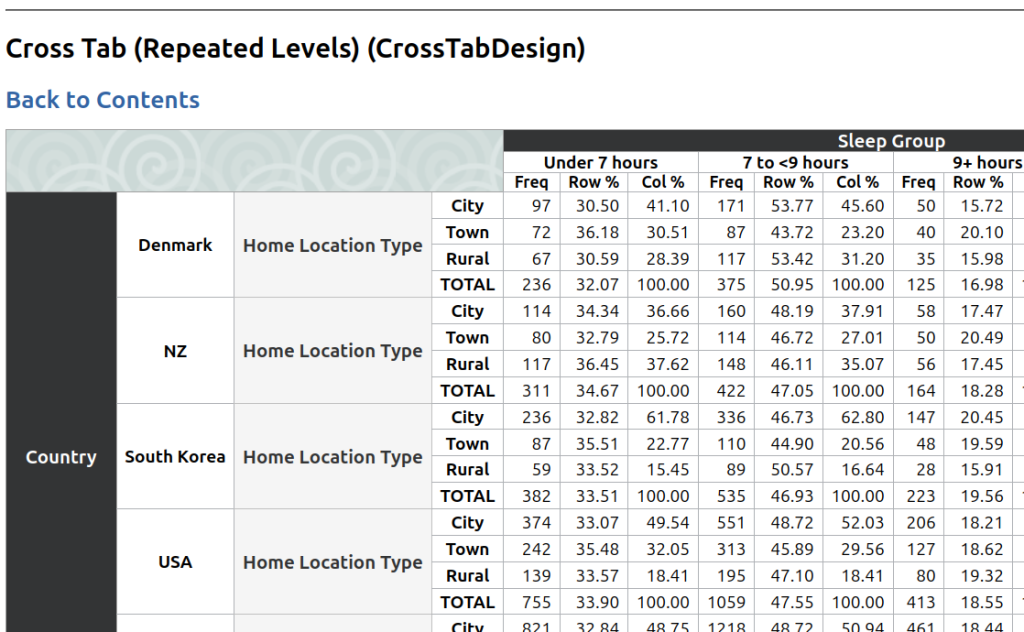
sofastats_lib can help. Look at the Output Gallery to see what is available. Here is the output of a simple Cross Tab table (based on synthetic demonstration data):
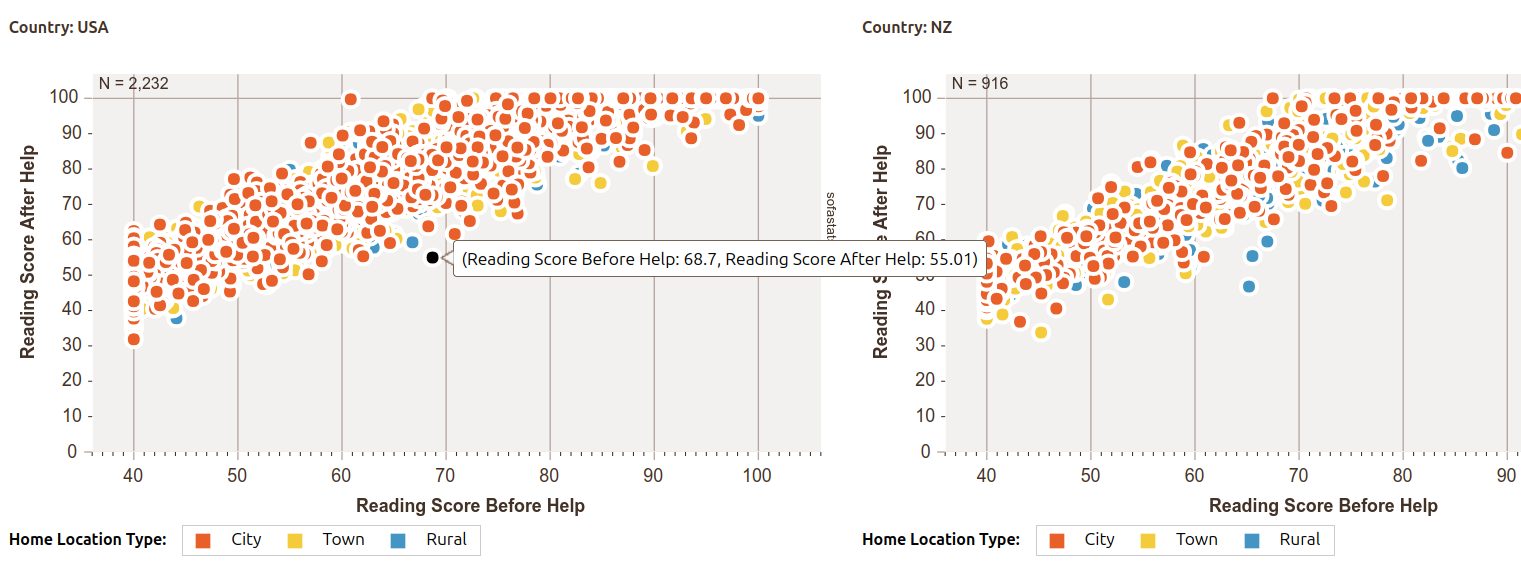
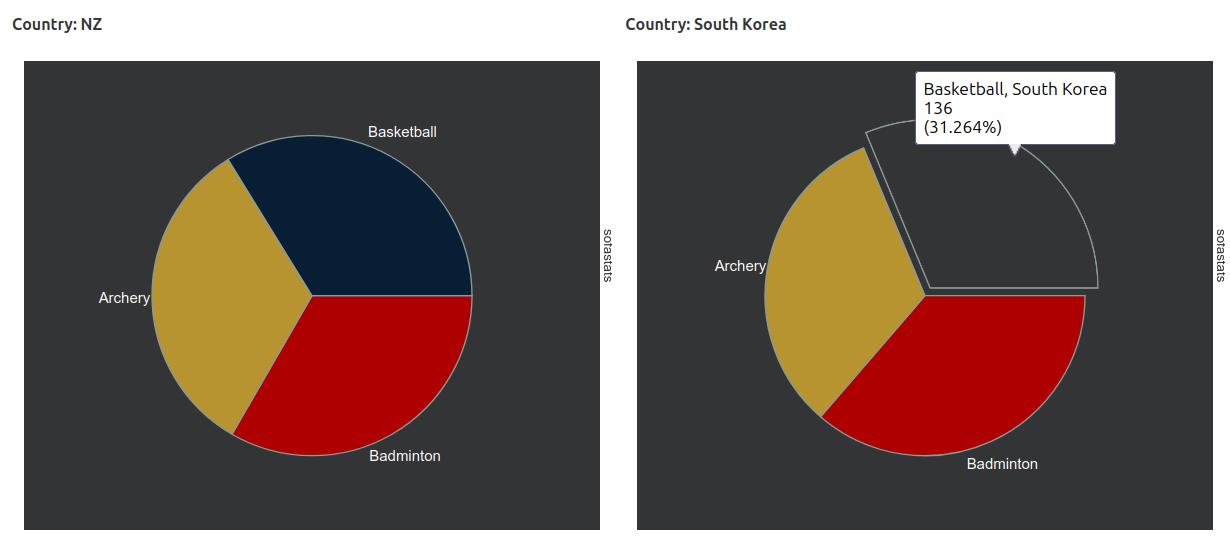
And here’s a preview of some of the charting options (also using synthetic data):

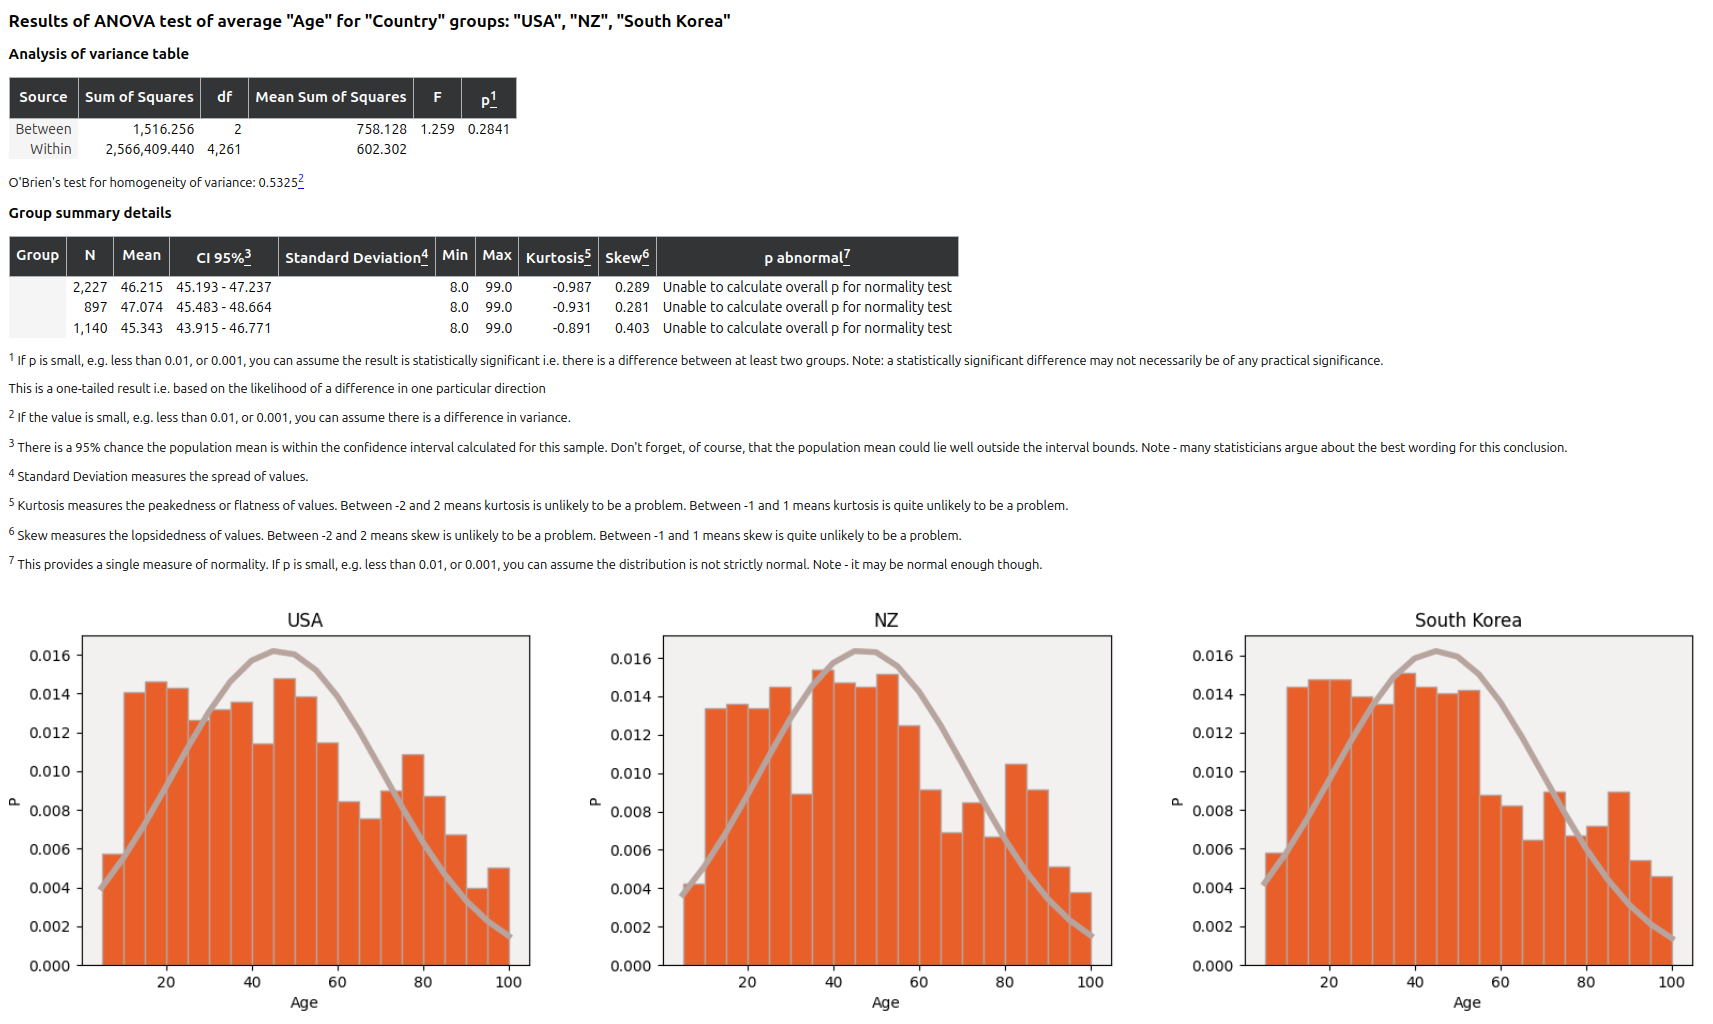
And the existing ANOVA documentation (once again, using synthetic data):
The full API is documented here: https://sofastats.github.io/sofastats_lib/API/ and there is a simple guide to making and reusing your own styles.
The easiest option is to start with a CSV. Just make sure it is long format not wide format (see Data Preparation).
sofastats_lib is based on the tried-and-true SOFA Statistics desktop application but can be used like any other Python library.
You can add it to your project in the usual way e.g. uv add sofastats_lib. Friendly installation and usage instructions are available at https://sofastats.github.io/sofastats_lib/
Let us know what you think of sofastats_lib. We can be contacted at grant@sofastatistics.com or you can add issues to the GitHub project. And please spread the word.


