Archive for the ‘Uncategorized’ Category

Version 1.5.4 – Hopefully Boring ;-)

Thursday, January 14th, 2021

Version 1.5.4 of SOFA Statistics has been released. It supports a wider range of SQL Server versions and has numerous bug fixes. It:

  • Supports more versions of MS SQL Server by switching to the pyodbc library (from a deprecated library)
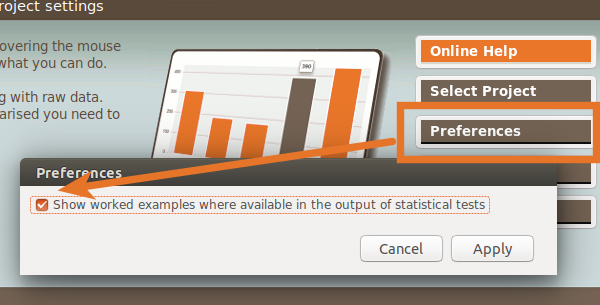
  • Standardises multiline checkboxes
  • Copes with different versions of openpyxl without forcing Linux users to pin the version (which may not be in their distro)
  • Fixes width of main form help text in Windows
  • Fixes chart display bug in Windows by forcing IE11 emulation (vs IE7)
  • Fixes spreadsheet export bug – use column letter rather than name
  • Fixes bug when exporting CSV with label columns
  • Fixes sorting in Data List reports
  • Fixes bug where renaming a project left the original intact
  • Fixes bug preventing decimal point settings being honoured in Summary report tables and Data List reports

In a sense, 1.5.4 is what I actually hoped 1.5.0 would be. It just took a while to identify and remove all the bugs in the 1.5 series resolved so far.

I am reasonably satisfied with the features available in SOFA so my main goals going forwards relate to stability as underlying technologies change below SOFA e.g. GUI platforms, operating systems etc. What I’d really like to do next is release a Mac version for the 1.5 series but that will require some help from the Mac developer community (see previous blog post).

Version 1.5.1 mops up variety of bugs

Sunday, May 19th, 2019

SOFA Statistics 1.5.0 was a big change from previous versions in terms of its underlying technologies. Unfortunately that meant a number of bugs made it past release testing. Every bug identified so far has been fixed in 1.5.1 so now is a good time to upgrade.

SOFA turns 10!

Wednesday, May 15th, 2019

SOFA Statistics was first released in May 2009. Since that time SOFA has been downloaded nearly 300,000 times – which is about 10,000 times more than I ever expected :-). Since that time many statistics packages have faded away and others have risen. Hopefully, SOFA Statistics has been a good option for many people and the recent replatforming onto Python 3 and wxPython 4 will enable SOFA to continue for many years to come.

Worked examples in 1.5.0

Wednesday, May 15th, 2019

Statistics can be mind bending and complex. It can make your brain hurt and your heart despair. But sometimes it is very simple and easy to follow. Four of the statistical tests provided by SOFA Statistics – namely

  • Mann-Whitney U
  • Wilcoxon’s Signed Ranks
  • Spearman’s Rho
  • Pearson’s Chi Square

– are reasonably easy to understand with worked examples. You could even say they are elegant in their simplicity. Check out the new worked examples feature of SOFA Statistics version 1.5.0.

The worked examples use your actual data so you should be able to follow the logic of the test step-by-step if you are interested in learning how it works. The goal is to demystify the tests and appreciate them better.

Other changes in version 1.5.0 include the following:

  • You can now choose the number of decimal places to show in report tables and charts.
  • Can display counts or percentage separately on pie charts.
  • Better smoothed line displayed for line charts.
  • Easier to run generated scripts for testing (only need to set use_locally boolean).
  • Better visual separation of subtables.
  • Charts can show N.
  • Improvements to darker themes.
  • Add ability to define table to automatically open on startup (using open_on_start setting in projs/default.proj).
  • Ask users if they want to override existing project if adding new project with an already-used name.
  • Upgraded to newer GUI library (wxPython 4.0).
  • Added new safeguards and user feedback when problems converting output to images.
  • Dropped support for xls (xlsx is supported alongside tsv, csv, ods etc)
  • Dropped support for CUBRID (largely because drivers for newer versions of Python are not available)

There are also numerous important bug fixes:

  • Important bug fix for filters with OR conditionals.
  • No longer fails to copy to clipboard when chart names include slashes.
  • Scatterplots now cope with variable names including percentage symbols.
  • Fixed bug displayed empty values in Display Data report tables.
  • Fixed bug with Select All/Deselect All button not working correctly in all cases.
  • Fixed bug when repairing duplicate names in import.
  • Only give project override warning when a new file
  • Add sky.css to styles deployed

SOFA Statistics has received a major overhaul under the hood for version 1.5.0 (for example, the shift to Python 3.6/7 from 2.7). Inevitably there will be some issues but the intention will be to resolve those as quickly as possible. Enjoy!

New feature – Chart averages in version 1.0.5

Monday, May 16th, 2011

Do you want to make a line chart of average income by month? Or a bar chart of average height by country? The latest release of SOFA lets you do that very easily:

Chart Averages

Other improvements include:

  • Tab and Enter now work in a more intuitive way when in a settings grid. New rows which are incomplete produce a useful warning to the user.
  • Better support for Right-to-Left language locales.
  • Regression line intercept and slope included in Pearson’s Correlation output as well as a better regression line on the scatterplot.

A number of bugs have been fixed as well:

  • Fixed bug occurring when user selects a google docs spreadsheet and clicks on download after manually selecting a spreadsheet but without manually selecting a worksheet.
  • Fixed bug with report tables which occurred sometimes when a field value was the same as a field name.
  • Fixed bug when pie chart label has new line characters in it.
  • Adjusted y-axis placement on bar charts so not truncated in some cases.
  • When importing ODS data without a header, and responding to a data type inconsistency with Cancel, the progress bar is now reset to the start.
  • Fixed bug when saving projects in Windows with different name (albeit the same name if case insensitive). Would not appear in the Project Selection list and would be unable to reopen the Project Selection dialog.

Configurable charting in SOFA Statistics 0.9.19

Monday, October 4th, 2010

Most of the SOFA charting functionality is now in place and it is now possible for users to configure their output charts. In addition to being able to select theming, the following options are currently available:

Simple bar charts and pie charts can now be sorted (unsorted, by label, by frequency, by descending frequency).

Sortable chart example

Sortable chart example

Users can include or exclude display of percentages in bar, line, and area chart tooltips.

Hiding percentage in tool tips

Hiding percentage in tool tips

Axis titles on charts are now bold and better positioned vertically to distinguish more easily from axis labels.

Better axis titles

Better axis titles

Another change is that histogram have more human-friendly bin sizes where possible e.g. 10 to <20 rather than 13.8 - 14.5 etc. [caption id="attachment_493" align="aligncenter" width="188" caption="Better histogram bins"]Better histogram bins[/caption]

Analysis dialogs have been simplified by shifting some settings into a separate dialog.

Simplified interface

Simplified interface

Chart type buttons have been restyled and it is easier to identify which button has been selected across operating systems:

Refreshed chart-type buttons

Refreshed chart-type buttons

The other main change to charting is that long chart labels are now split into lines.

Split line value labels

Split line value labels

Additional changes include:

  • Scatterplots have option of removing dot border (useful if almost all values are overlapping other values e.g. in a line).
  • Added hour glass for display of chart output (can matter for scatterplots on slower machines).
  • Existing default report is archived on upgrade to ensure any new chart content displays correctly in the default output.

There is one very important bug fix – 0.9.18 introduced a bug stopping two types of statistical test output from being generated. This was easily corrected.

Additional bug fixes include:

  • Flicker removed when changing between chart types in chart dialog.
  • Fixed bug when changing variable details in charting dialog.
  • Scatterplots drop minor ticks when few unique x values e.g. agegroup vs weight.
  • Chart buttons visibly change when selected, even on Mac.
  • Fixed layout and read-only status of config button in projects dialog.

SOFA Statistics is getting a lot closer to being ready for a version 1.0 release.

0.8.7 interface improvements plus PostgreSQL and MS fixes

Tuesday, September 8th, 2009

Version 0.8.7 has the following improvements:

  • Dialogs for making report tables and for configuring statistical tests now have close buttons in bottom right like elsewhere. Plus other minor UI improvements.
  • Important bug fixes for PostgreSQL and MS Access and MS SQL Server.

Bug fixes:

  • Made it unnecessary to run makepy to access the ADO constants for data type. Will enable users to connect to MS Access and MS SQL Server databases successfully.
  • A few minor fixes for postgresql problems when editing data (added some extra commits). Also fixed postgresql module bugs around numeric types lacking decimals.
  • Corrected code for getting min and max values for numeric variables in PostgreSQL.
  • Opening a project file copes with any particular database engine being missing.