How to Use the Calculator
- Enter your frequencies into the input areas, starting at the upper left corner.
- Click the button to get your results.
It doesn’t matter if your categories are in the columns and your groups are in the rows. Just enter the data from your frequency table; the result will be the same. Any cell that you leave blank will be considered to be a zero.
Remember to use frequency counts, not percentages. If more than twenty percent of your cells have a frequency count less than five, then your result will be unreliable.
What is Chi-Squared?
The chi-squared (χ2) statistic tests to see if two or more groups differ on some categorical (also called “nominal”) variable. That sounds very complicated, so let’s take an example.
You want to find out if there’s a difference between men and women when it comes to using their turn signals at a stop sign. In this case, your groups are men and women, and the variable you are testing is “using turn signals,” which has two categories: yes (they use them) and no (they don’t).

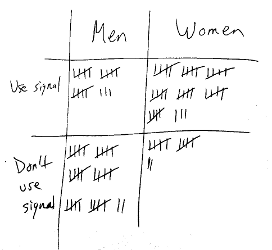
You go to a stop sign with a clipboard, pen, and paper, and you observe the first 100 drivers, making a tally mark in the appropriate area of your table.
When you finish, you count the marks in each section, which gives you your frequency count.
| Men | Women | |
|---|---|---|
| Use signal | 18 | 38 |
| Don’t use signal | 32 | 12 |
Now, enter the frequency counts into the calculator and click the button. You will then see the results:
Value of χ2 is 16.234 with 1 degree of freedom. Probability value p is < .001 This is a highly significant result. From looking at the table, you can see that the women from this observation tend to use their turn signals significantly more than the men.
Yes, but how does it work?
Let’s look at the totals for the rows and columns. The last row of the table shows that there are an equal number of men and women.
| Men | Women | Total | |
|---|---|---|---|
| Use signal | 18 | 38 | 56 |
| Don’t use signal | 32 | 12 | 44 |
| Total | 50 | 50 |
If there were really no difference in using turn signals, you’d expect the 56 people using turn signals to be split evenly between the men and women. Similarly, you’d expect the 44 people who didn’t use turn signals to be split evenly between the genders.2 Here’s the table again, with the expected numbers in red below the observed counts.
| Men | Women | Total | |
|---|---|---|---|
| Use signal | 18 28 |
38 28 |
56 |
| Don’t use signal | 32 22 |
12 22 |
44 |
| Total | 50 | 50 |
The further away your observed values are from the expected values, the more likely it is that there really is a significant difference between the groups. The χ2 calculation figures out these “distances” from the expected value, and the larger that number, the less the probability of retaining the null hypothesis (that there’s no difference at all).
Yes, but how is χ2 really calculated?
The computer goes to each entry in the table and calculates the observed value minus the expected value. It squares that number, and divides by the expected value. The result is the “distance” for that cell. The value for the cell at the upper left would work out to (18 – 28)2 / 28, or 3.571429. Then the computer adds up all of those values, and the result is χ2.
1
Written by J. David Eisenberg
2 If the proportions were, say, 60% men and 40% women, then the expected values for the use signals / don’t use signals numbers would be split 60% / 40% also.

